Wintec Visual Media Guide
Page 1 of 4
Revised Dec 2017
APA Referencing (6
th
edition): Visual Media
Images, Figures & Tables
This is a Wintec guide to help you with referencing in the American Psychological Association (APA)
style for images, figures, and tables. For further information, please refer to the 6th edition of The
Publication Manual of the American Psychological Association (2010), or see a staff member in the
Library, Student Learning Services or Te Kete Kōnae.
•
Images are a type of figure. They are visual depictions e.g. pictures, photographs etc.
•
Figures are charts, graphs, photographs, drawings or any other illustration.
•
Tables are numerical values or textual information displayed in columns and rows.
•
At times the difference between figures and tables can be unclear, but tables are almost
always displayed as row-column format. ANY other illustration is referred to as a figure.
Captions/Notes & Reference List
In-text citation
IMAGES - ONLINE
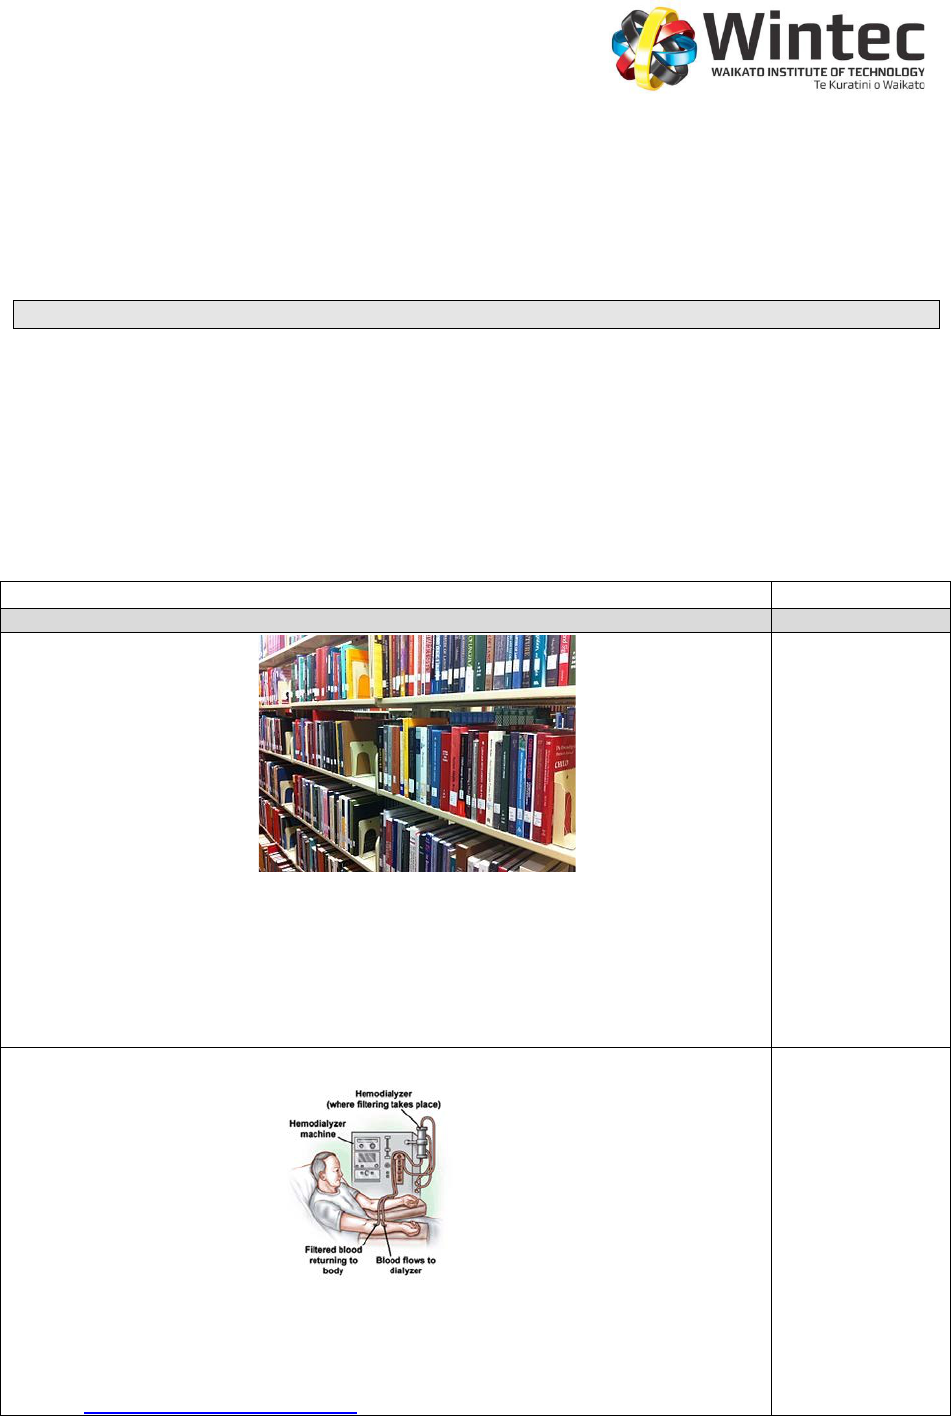
Figure 1. Shelves of language books in library (Source: ParentingPatch, 2013)
Reference list:
ParentingPatch. (2013, April 9). Shelves of language books in library [Photograph]. Retrieved
from https://commons.wikimedia.org/wiki/File:Shelves_of_Language_Books_in_Library.JPG
NB in the absence of a title, write a descriptive title and enclose in square brackets in the
reference list
Because the in-text
citation and all the
relevant
information is in the
captain below the
image, simply use
the numbered
figure in the body
of your assignment
as shown below:
Figure 1 shows
books suitable for
ESOL students.
There are many
language books in
the library (see
figure 1).
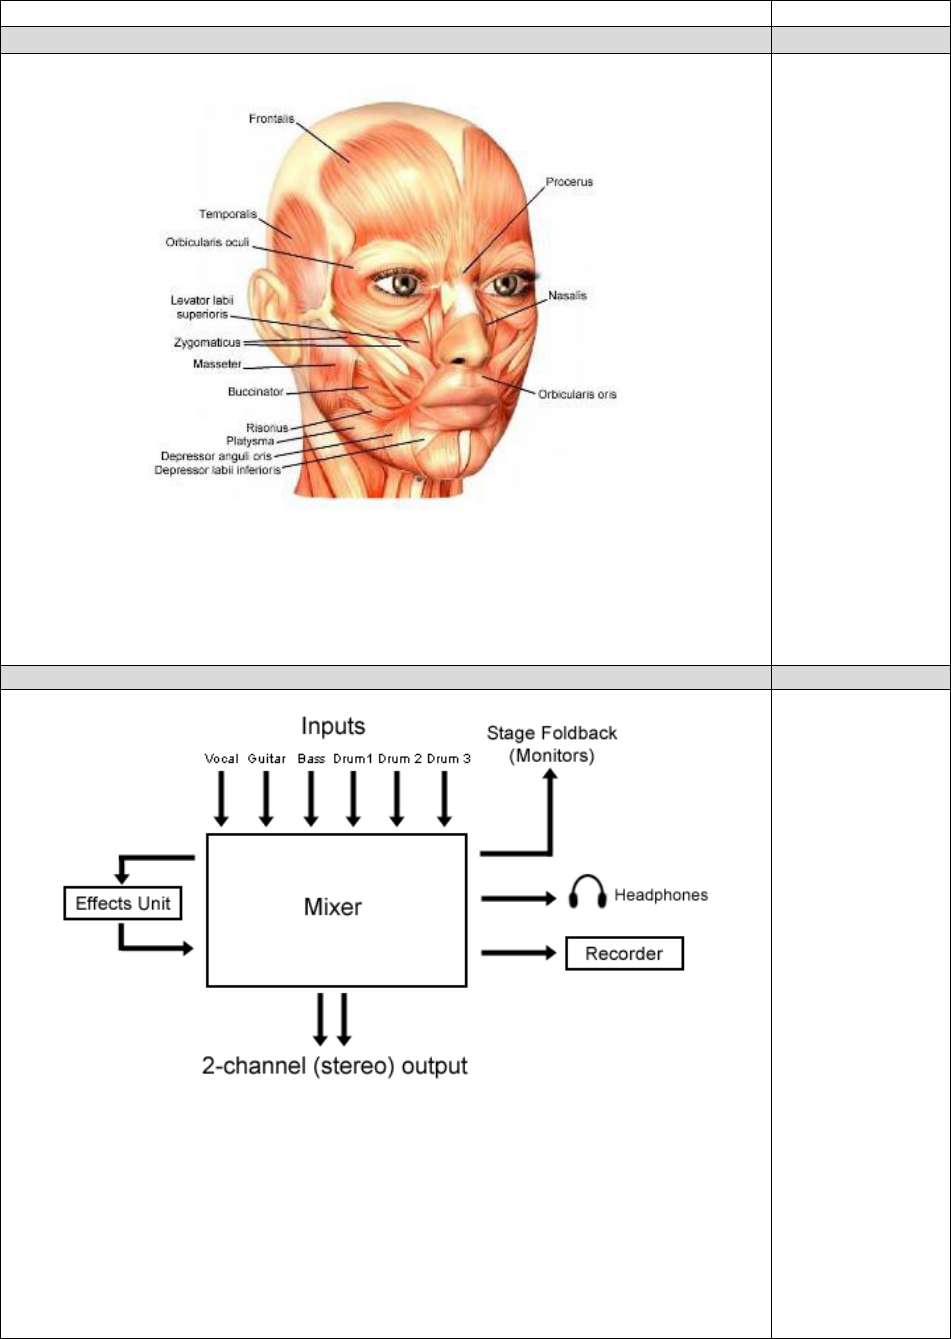
Figure 2. Dialysis machine (Source: San Fernando Valley Vascular Group, n.d.)
Reference list:
San Fernando Valley Vascular Group. (n.d.). [Dialysis machine] [Image]. Retrieved from
http://www.sfvvg.com/dialysis.html
Figure 2 shows a
basic diagram of a
dialysis machine.
Sometimes
patients need to be
hooked up to a
dialysis machine
(see figure 2) as
part of their
treatment.
The difference between images, figures, and tables
Wintec Visual Media Guide
Page 2 of 4
Revised Dec 2017
Captions/Notes & Reference List
In-text citation
IMAGES – BOOK – NOT CREDITED (Reference author of book)
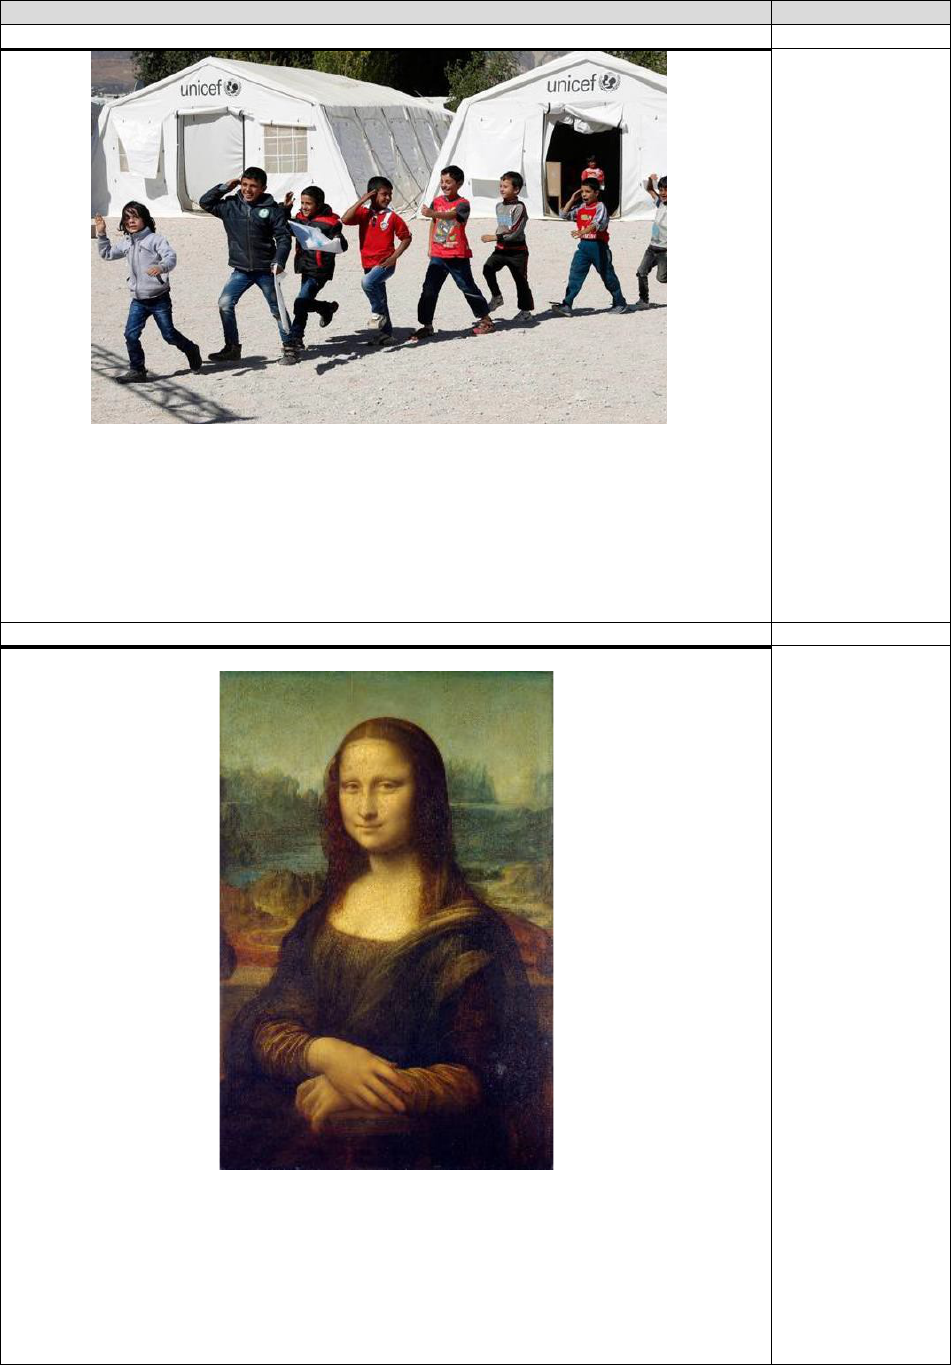
Figure 3. Muscles of the head and neck (Source: Herlihy, 2014, p. 160)
Reference list:
Herlihy, B. (2014). The human body in health and illness. St. Louis, MO: Elsevier.
NB reference the book from which the image was copied
Figure 3 shows the
basic muscles of
the head and neck.
There are many
muscles in the
head and neck
(see figure 3).
IMAGES – BOOK – CREDITED (Reference illustrator & author)
Figure 4. Three-dimensional mixing metaphor (Source: Fergusson, in Savage, 2014,
p. 24)
Reference list:
Savage, S. (2014). Mixing and mastering in the box: The guide to making great mixes and
final masters on your computer. (I. Fergusson, Illus.). Oxford, England: Oxford
University Press.
NB reference the book from which the image was copied
Figure 4 shows the
difference
components of a
mixer.
You can input a
number of different
instruments into a
mixer (see figure
4).
Wintec Visual Media Guide
Page 3 of 4
Revised Dec 2017
IMAGES – BOOK – MAJOR PART
A. Illustrations all by one creator
Figure 5. Lebanese children play outside at lunch time (Source: Brown-Martin &
Tavakolian, 2014, p. 158)
Reference list:
Brown-Martin, G., & Tavakolian, N. (Photographer). (2014). Learning {re}imagined: How the
connected society is transforming learning. London, England: Bloomsbury.
NB reference the book from which the image was copied
Figure 5 pictures a
crowd of Lebanese
children playing
outside at
lunchtime.
Despite living
through times of
trouble, these
children still find
time to play
together (see figure
5).
B. Illustrations by many different creators (such as in an art history book)
Figure 6. Mona Lisa by Leonardo da Vinci (Source: Gombrich, 1983, p. 117)
Reference list:
Da Vinci, L. (1983). Mona Lisa [Image]. In E. H. Grombich (Ed.), Vision and painting: The
logic of the gaze. New Haven, CT: Yale University Press.
NB reference both the image itself and the book from which the image was copied
Figure 6 is of
course the famous
Mona Lisa.
One of the most
instantly
recognizable
paintings of all time
would have to be
da Vinci’s Mona
Lisa (see figure 6).
Wintec Visual Media Guide
Page 4 of 4
Revised Dec 2017
FIGURES
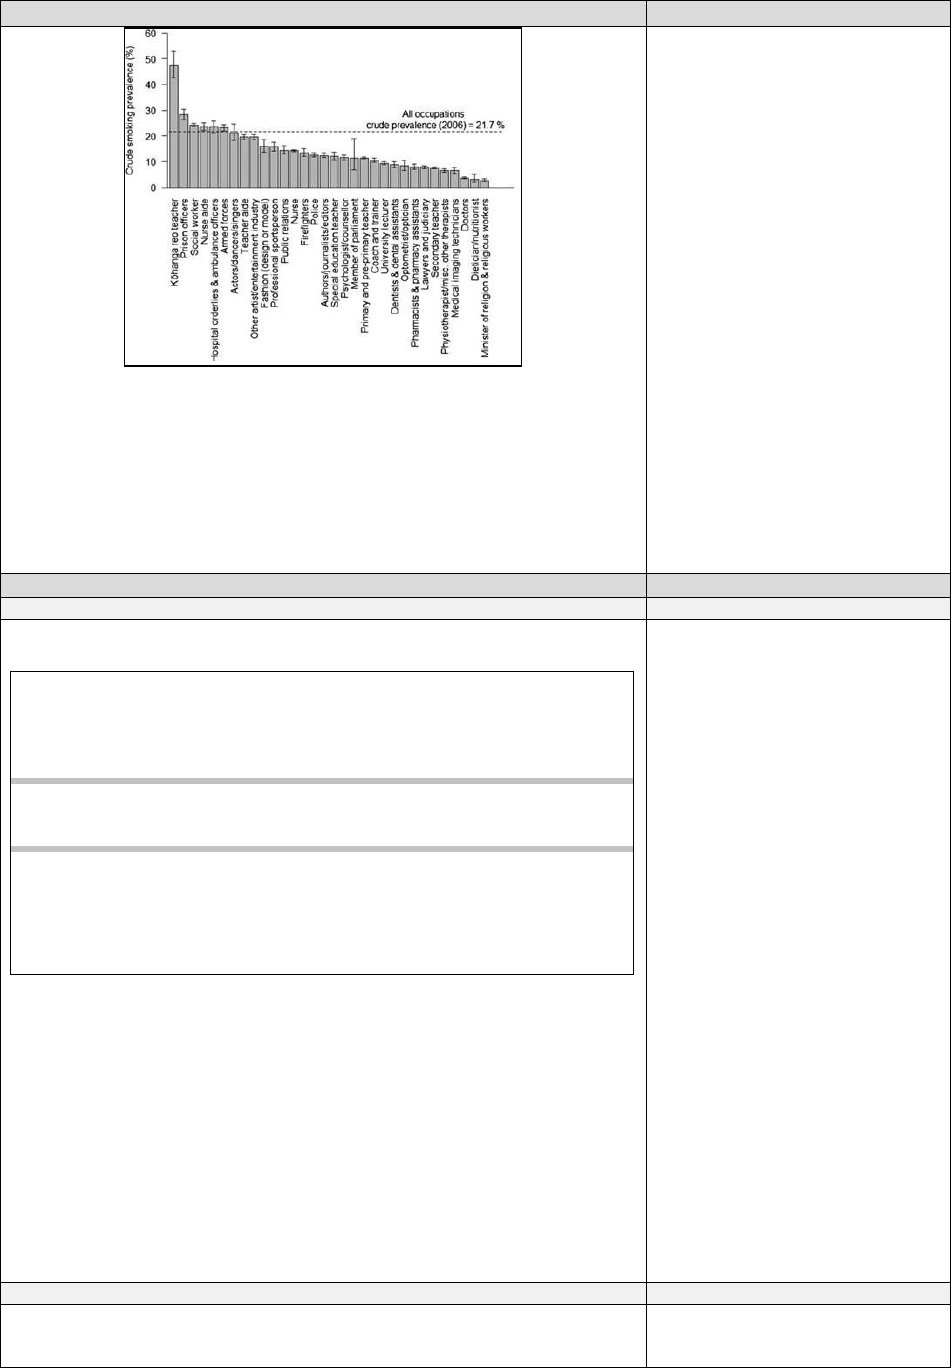
Figure 7 provides an illuminating
picture of the correlation of
different occupational groups and
their smoking habits.
Smoking can be linked broadly to
different occupational groups (see
figure 7).
Figure 7. Crude smoking prevalence in 2006 census by occupational
group (bars, with 95% CI) (Source: Edwards et al., 2012, p. 332)
Reference list:
Edwards, R., Peace, J., Stanley, J., Atkinson, J., Wilson, N., & Thomson, G.
(2012). Setting a good example? Changes in smoking prevalence
among key occupational groups in New Zealand: Evidence from the
1981 and 2006 censuses. Nicotine & Tobacco Research, 14(3), 329-
337. Retrieved from Academic Search Premier Database.
TABLES
Tables reproduced and referred to in assignment
Table 1
Success Rates of Planned and Unplanned Quit Attempts
Note.
* Most recent attempt to stop smoking. † Percentage (95% confidence
interval). Reproduced from “Catastrophic pathways to smoking
cessation: Findings from national survey,” by R. West, 2006, British
Medical Journal, 332(7539), p. 459. Copyright 2006 by BMJ
Publishing Group. Reprinted with permission.
NB: This is an example from APA showing the full reference and copyright
information for publishing purposes. For your unpublished or
undergraduate assignments you can treat the table as a direct quotation
eg. (West, 2006, p.459).
Reference list:
West, R. (2006). Catastrophic pathways to smoking cessation: Findings from
national survey. British Medical Journal, 332(7539), 458-460. doi:
10.1136/bmj.38723.573866.AE
Table 1 contrasts the success
rates of planned and unplanned
quit attempts.
Planned attempts to quit smoking
are much more effective than
unplanned attempts (see Table 1).
Table numbers are written
sequentially and should not be
followed by a full stop. When
referring to each table in text, then
use a capital T.
Table Titles are placed
immediately under the table
number and above the table. Titles
are written in italics and should
provide a brief explanation of the
table. Use capitals for main words,
but no full stop after the title.
Notes are written directly under the
table with the word Note in italics
with a full stop. Notes include
explanations of abbreviations,
symbols and acknowledgement
that the table has been reproduced
from another source.
Table referred to but NOT reproduced in assignment
In-text citation
West, R. (2006). Catastrophic pathways to smoking cessation: Findings from
national survey. British Medical Journal, 332(7539), 458-460. doi:
10.1136/bmj.38723.573866.AE
The percentage of planned …
(West, 2006).
Smokers and ex-
smokers: 6
months to 5
years before
*
(n=611)
Smokers and-ex-
smokers: 6-12
months before
*
(n=191)
Current
smokers: 6
months to 5
years before
*
(n=391)
Lasted Total
≥6 %
months
†
(No)
Lasted Total
≥6 %
months
†
(No)
Lasted Total
≥6 %
months
†
(No)
Unplanned
65.4
45.8
50.0
35.6
38.1
39.6
(59.8 to
(280)
(37.6 to
(68)
(30.4 to
(155)
70.1)
62.4)
45.7)
Planned
42.3
54.2
28.5
64.4
20.6
60.4
(37.0 to
(331)
(20.5 to
(123)
(15.6 to
(236)
47.6)
36.4)
25.9)
